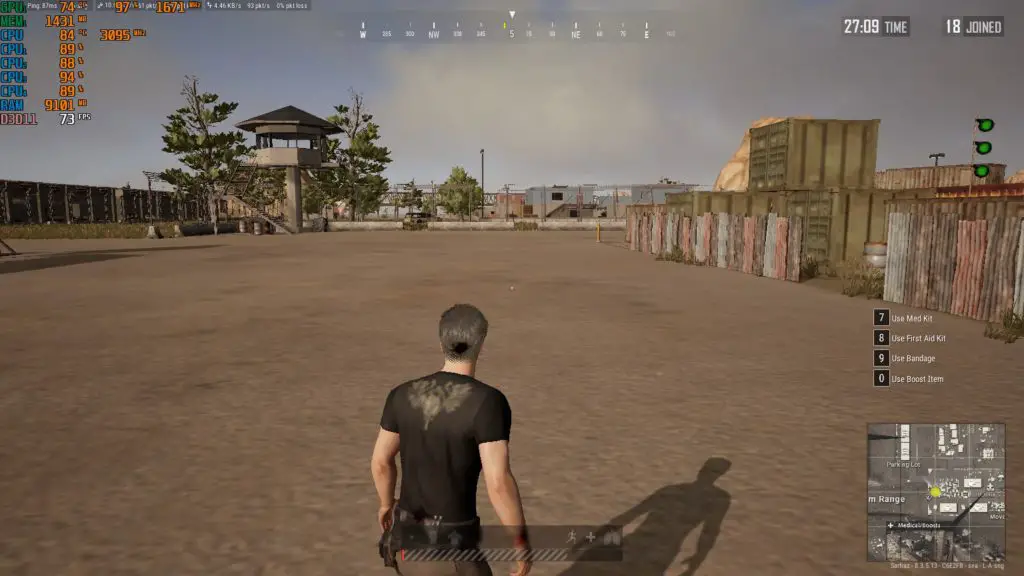
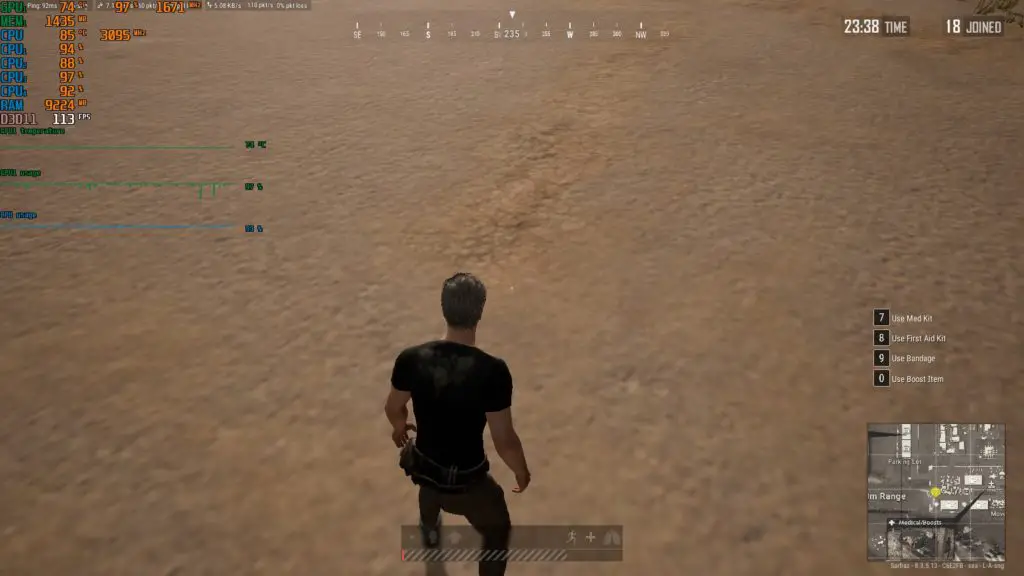
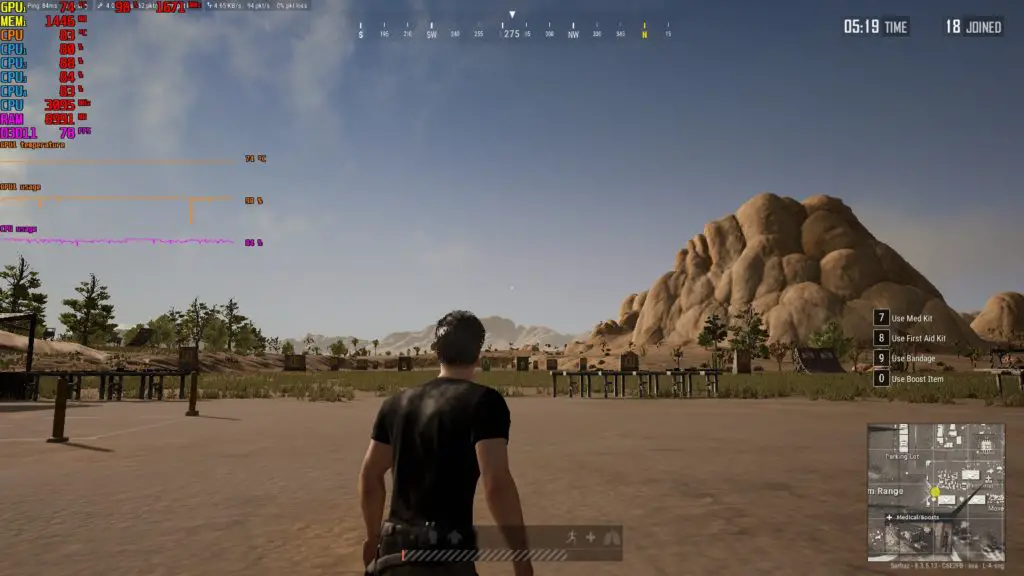
MSI Afterburner has an excellent feature for monitoring your components’ real-time condition and performance. You must have seen the on-screen metrics in gameplay videos on Youtube, especially in videos that compare different graphics cards and CPUs.
While the MSI Afterburner on-screen display has a lot of things to tweak, this is a brief and simple guide if you want to know how you can use MSI Afterburner for monitoring your components.
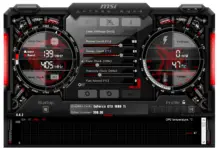
Step 1: To begin with this process, you first need to install MSI Afterburner and open it. From here you will see a lot of things like the Core clock, memory clock, and graphs that show things like GPU temperature, GPU fan speed, GPU usage, CPU metrics, and memory metrics.
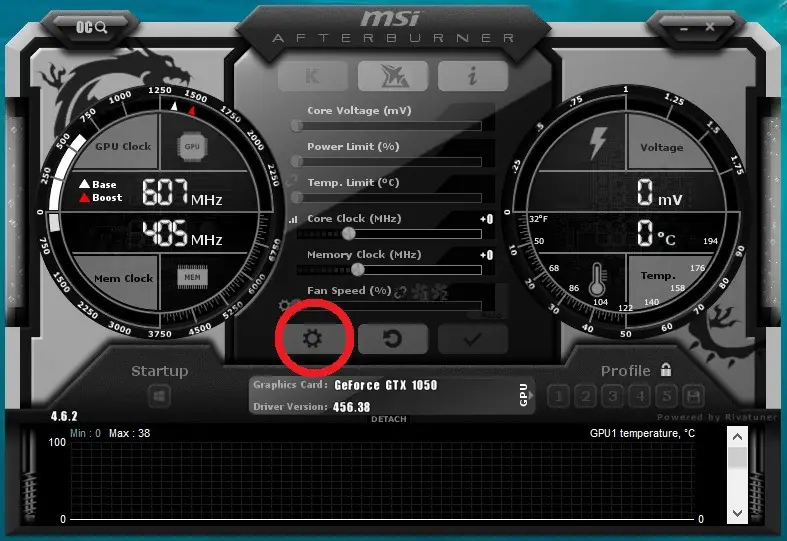
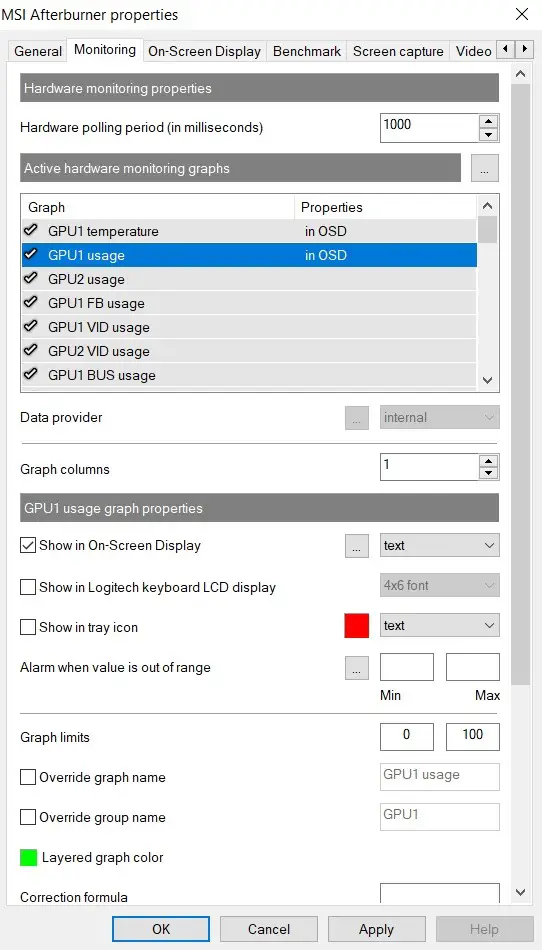
Step 2: Open the settings and head to the Monitoring tab. Here you will see some options that will help you achieve desired on-screen metrics. First, you will need to learn how to display different metrics in your game. Note that you can also change whatever you wish while you are inside the game.
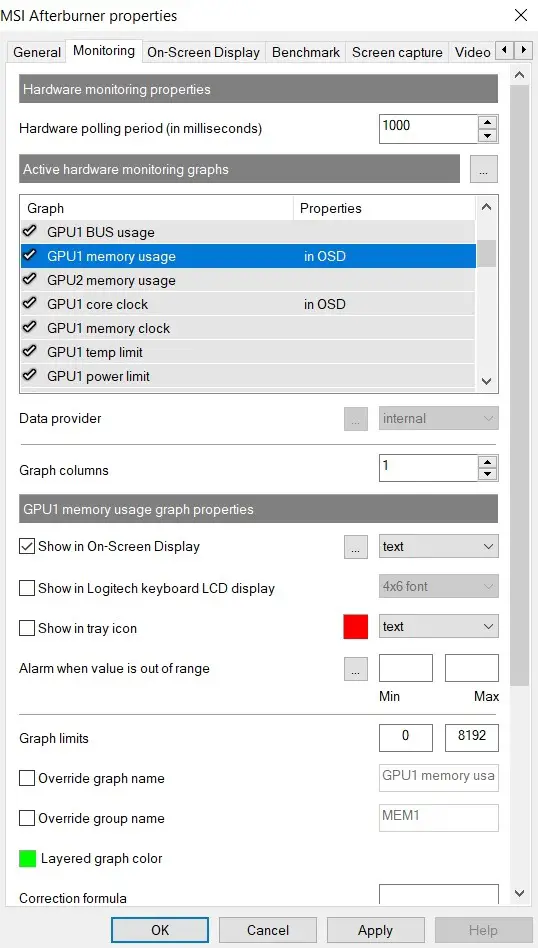
You will see a lot of options under the Active hardware monitoring graphs like below. You can scroll down to see all the possible options or metrics you can show on your screen. Select a metric and check Show in On-Screen display to show that metric in games. You can do this with as many metrics as you want.
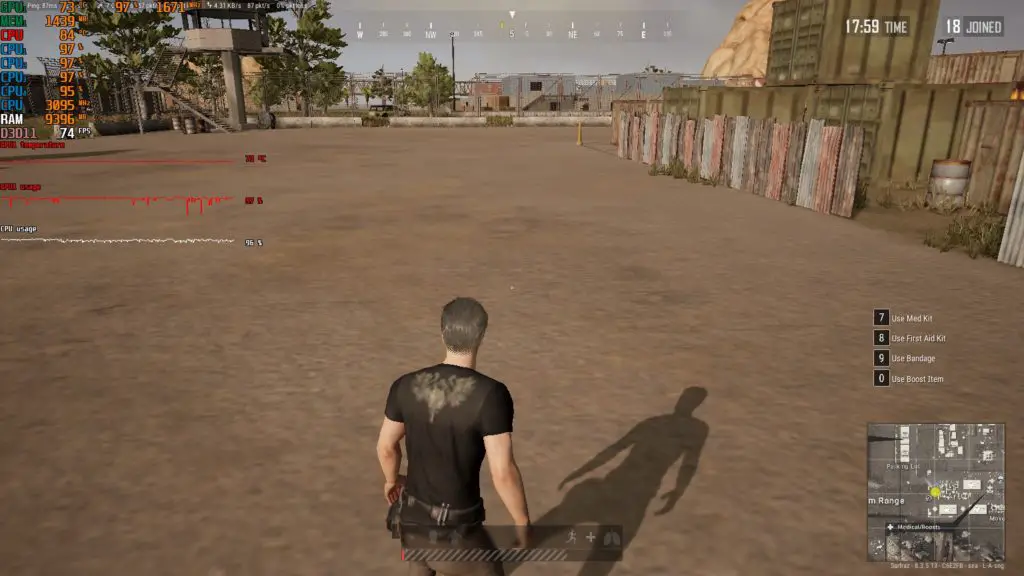
Step 3: The tool is also capable of showing metrics through graphs which is really helpful for looking into the short history of particular metric ups and downs. All you need to do is select the Graph option in front of Show in on-screen display. You can also select Text+Graph for both textual and graphical representations.

Related- How to Use MSI Afterburner- A To Z Guide
Now if you look at the graphs in the image above, they aren’t as clear as they should be. So, we need to change their color. Fortunately, you can change the color of each metric and its value through this feature.
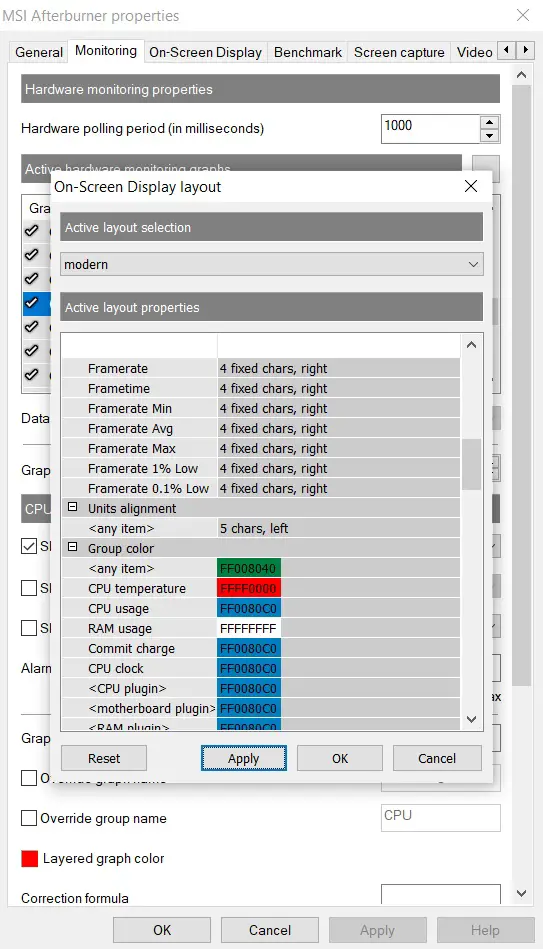
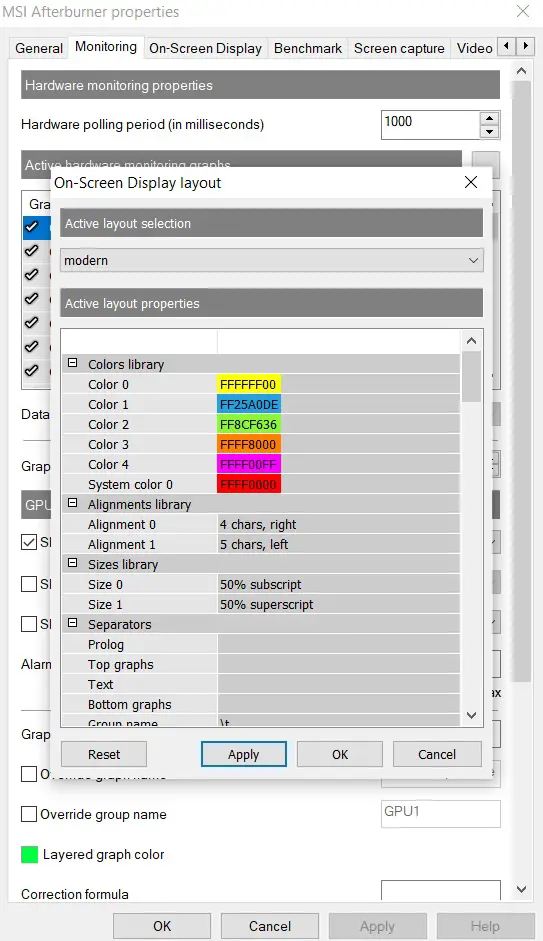
Step 4: Before the Text and graph option from where you just enabled the graphs is a button with 3 dots. Click on it and a window of On-Screen Display Layout will open.
Scroll down and under the Group Color, you can choose any color for your metrics from the default options.
Or you can just change the default colors from the Colors Library that is situated at the top.
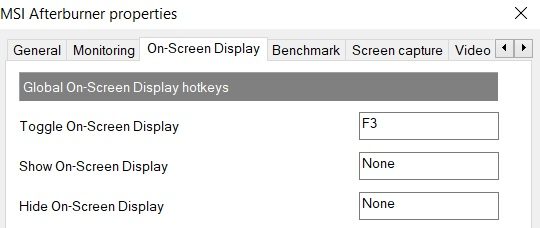
Step 5: Now as you can tweak these things endlessly, the final thing is to assign a key to Toggle this feature On or Off in the game.
If you go to the On-Screen Display tab, there is an option called Toggle On-Screen Display under Global On-Screen Display. Assign any key that doesn’t conflict or actuate any action inside the game you are playing.
Note:- Make sure when you use the MSI On-Screen Display feature, Rivatuner Statistics Server is running in the processes for a real-time update or you can just run it from the MSI Afterburner’s installation folder.
Related:- Control GPU fan speed in MSI Afterburner
